Hi everyone, I'm very happy those days because I've started at my first job, I hadn't worked out of the university before.
So I'm living out of my home, in another state, but now I'll restart to make posts in my blogs.
I wish everyone were a merry Christmas and a blessed new year.
And for my readers who have send questions, I ask you send me your questions again.
Thank you for reading my blogs and let's study and learn.
Sunday, December 26, 2010
Thursday, November 4, 2010
Thank you CV
I read four comments from CV today, and I'd like to say thank you CV, a reader like you motivates me to stay improving this blog.
About your comments, try this toolbox for USB connections and, about car plates, I'll make some posts for it.
So, I'm happy with my readers and I ask God bless everyone.
Thank you again.
About your comments, try this toolbox for USB connections and, about car plates, I'll make some posts for it.
So, I'm happy with my readers and I ask God bless everyone.
Thank you again.
Tuesday, October 19, 2010
Scilab consortium member
Today I was invited to take part in a community of math, science and technology based on Scilab software, it's Equalis.
I've been very happy because I believe Scilab is a great software and this software just needs people who help it to become better.
Now, I'd like to invite my readers to make an account in Equalis' site, but I ask you don't forget my blog.
So, it's all. Let's improve our applications using Scilab.
I've been very happy because I believe Scilab is a great software and this software just needs people who help it to become better.
Now, I'd like to invite my readers to make an account in Equalis' site, but I ask you don't forget my blog.
So, it's all. Let's improve our applications using Scilab.
Wednesday, July 28, 2010
Car plate tracking
I found an old project that I developed during my graduation course which consists in a car plate tracking system.
It was developed in Python in 2007, but I translated it to Scilab, in some minutes, today.
I used SIVp toolbox and simple pattern recognition and digital image and signal processing techniques in this system.
The system is tested with a set of images from a Brazilian repository which has many images of cars.
Look the result of the system.

If anyone is interested in this system, come on let's talk about it. We can try to improve it.
Tuesday, July 20, 2010
Scilab for GPIB or USB devices
I received a comment here and the commenter wants to know how to connect a PC in a USB or GPIB device.
Ric, you need to install the driver Visa and the toolbox that has functions to access the driver, you can try this toolbox.
This driver, Visa, isn't free (open source) but you can download it in the web easily.
So, if you, or anyone else, have any question, I'll try to help you again.
Ric, you need to install the driver Visa and the toolbox that has functions to access the driver, you can try this toolbox.
This driver, Visa, isn't free (open source) but you can download it in the web easily.
So, if you, or anyone else, have any question, I'll try to help you again.
Tuesday, June 22, 2010
GPIB devices
I worked in a laboratory that works with wireless telecommunications.
There, I developed a software that connects with ZVA 40 Network Analyzer (Rohde&Schwarz product). The software was first developed in Scilab (off course) and, later, I translated it to Python.
Recently, I was recalled for solving a problem with the same device, because they were working with an Agilent's software. I think it's a great company and it products are very good, but Agilent's support couldn't solve the problem that they had.
I wanna say Agilent has good solutions, but if the client has some problem, it probably won't be solved.
So I though to help somebody more. I develop free software, it means I won't sell a product. I develop softwares as a service, and you'll pay me for what I've done.
The software that I have connects to R&S ZVA 40, configures it and gets the signal plotting a graph and saving files. The configuration includes frequencies of capture, number of points, type of data (linear, log, polar, real part, imaginary part, Smith, etc) and the channel of capture: S11, S12, S21 and S22.
Now, if you use any GPIB device and have problems with it, I'll help you.
Thursday, June 17, 2010
New layout
I've studied some web technologies and I decided to change my blog's layout.
You can see the changes, but some news are coming soon to here.
I thank to my readers, since January 2009 when I created this blog. I've learned too much with each one.
I wish those days were a new begging in my blogs, and the new layout is just a sign of the future.
Thank you again, and let's learn more about science using Scilab.
Saturday, May 1, 2010
M.Sc Engineer
Hi my readers, I'd like to share my happiness with you.
I presented my master's dissertation last week, and it was accepted.
Now, I'm an engineer and a master in engineering.
I'm correcting the text, perhaps I won't be too fast for responding your questions, but I'll try not to harm anyone.
Thanks for everyone who reads the blog, and God bless us.
I presented my master's dissertation last week, and it was accepted.
Now, I'm an engineer and a master in engineering.
I'm correcting the text, perhaps I won't be too fast for responding your questions, but I'll try not to harm anyone.
Thanks for everyone who reads the blog, and God bless us.
Tuesday, April 13, 2010
Multiple 3D plots using colors
I received an e-mail with a question like this: how to make three graphs using plot3d(.) function, and each graph's color is different?
So, let's try it:
//limits on 'x' axis
X1 = 20;
X2 = 30;
X3 = 50;
//limits on 'y' axis
Y1 = 25;
Y2 = 50;
Y3 = 80;
//variables 'x' and 'y', for each function
[y1, x1] = meshgrid([1:Y1]', [1:X1]');
[y2, x2] = meshgrid([1:Y2]', [1:X2]');
[y3, x3] = meshgrid([1:Y3]', [1:X3]');
//functions
w1 = %pi/6;
z1 = sin(w1*(x1 + y1));
w2 = %pi/10;
z2 = cos(w2*(x2 - y2)) + 5;
z3 = tanh(x3 - y3) + 10;
//conversion for plot3d(.)
[xx1, yy1, zz1] = genfac3d(1:X1, 1:Y1, z1);
[xx2, yy2, zz2] = genfac3d(1:X2, 1:Y2, z2);
[xx3, yy3, zz3] = genfac3d(1:X3, 1:Y3, z3);
//making graphs on the same screen
plot3d(xx1, yy1, list(zz1, color("red")*ones(1, max(size(zz1)))));
plot3d(xx2, yy2, list(zz2, color("green")*ones(1, max(size(zz2)))));
plot3d(xx3, yy3, list(zz3, color("blue")*ones(1, max(size(zz3)))));
Or, if you prefer, you can use:
//same of the three last lines
plot3d([xx1 xx2 xx3], [yy1 yy2 yy3], list([zz1 zz2 zz3], [color("red")*ones(1, max(size(zz1))) color("green")*ones(1, max(size(zz2))) color("blue")*ones(1, max(size(zz3)))]));
Now, see the result:

So, it's all. Any question?
Monday, April 12, 2010
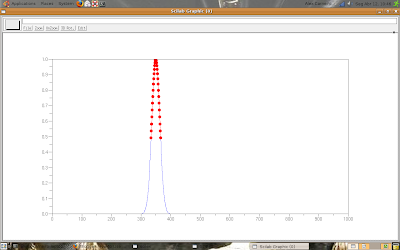
Full width at half maximum
Hi everyone, I have a new reader and we talked about Full Width at Half Maximum - FWHM here (in the comments).
We developed a code for finding the FWHM of a given peak in a function, and now the code will be posted in this post.
function [fwhm_positions, fwhm_values] = fwhm(x, positions)
tp = positions; //assign the peak position into tp
t_aux = 1;
while x(tp) < 2*x(tp + t_aux),
t_aux = t_aux + 1;
end;
fwhm_positions = (tp - t_aux):(tp + t_aux);
fwhm_values = x((tp - t_aux):(tp + t_aux));
endfunction;
t = 1:1000;
m = 350;
s = 180;
x = exp(-(1/(2*s))*(t - m).^2); // 'x' is a gaussian function
plot(t, x);
plot(fwhm_positions, fwhm_values, 'r.-');
Now, look the result following.
Thanks CV, you helped us too much!
God bless you.
We developed a code for finding the FWHM of a given peak in a function, and now the code will be posted in this post.
function [fwhm_positions, fwhm_values] = fwhm(x, positions)
tp = positions; //assign the peak position into tp
t_aux = 1;
while x(tp) < 2*x(tp + t_aux),
t_aux = t_aux + 1;
end;
fwhm_positions = (tp - t_aux):(tp + t_aux);
fwhm_values = x((tp - t_aux):(tp + t_aux));
endfunction;
t = 1:1000;
m = 350;
s = 180;
x = exp(-(1/(2*s))*(t - m).^2); // 'x' is a gaussian function
plot(t, x);
plot(fwhm_positions, fwhm_values, 'r.-');
Now, look the result following.

Thanks CV, you helped us too much!
God bless you.
Sunday, March 21, 2010
Professional R&D and consulting
I have the blog MultiSign, and I decided to begin a new work starting this week.
I'm offering services of research and development (R&D) and consulting.
I'll help everyone that asks me using this blog, the services of R&D and consulting are for "bigger helps" necessities.
This is the advertising about what I'm offering. If you're interested, you may tell me.
Any questions, everyone can use this blog too.
Monday, March 15, 2010
Discrete Fourier Transform - DFT
I made some posts about Discrete Fourier Transform (DFT), they're here.
But, I received a comment asking me how to do a function that implements DFT.
Let's only write a script, not optimized, that calculates DFT:
function X = DFT(x)
n = length(x); //number of elements in 'x'
omega = exp(-2*%pi*%i/n);
j=0:(n - 1);
F=omega.^(j'*j); //Fourier matrix
X = F*x(:); //X = DFT(x)
endfunction;
If anyone wants to try the showed function, you could do like this:
N = 10;
x = rand(N, 1);
X1 = DFT(x)
X2 = dft(x, -1) // dft(.) function uses flag = -1 for direct transform and flag = 1 for inverse transform
X3 = fft(x)
Now, look the values of X1, X2 and X3.
Did I help?
Tuesday, March 9, 2010
Fractions with numerator and denominator
I received a comment here.
The commentator asked me how to show a fraction as same as it was inserted.
For example:
x = 1/2;
disp(x)
1
-
2
So, I made a simple form for it.
-->function [x] = frac(n, d)
--> x = (n*%s)/(d*%s);
-->endfunction;
-->x1 = frac(1, 2);
-->disp(x1);
1
-
2
-->x2 = frac(2, 3);
-->disp(x2);
2
-
3
-->disp(x1 + x2);
7
-
6
-->disp(x1*x2);
2
-
6
-->x1 + 1
ans =
3
-
2
-->x1 + x2 - 2
ans =
- 5
-
6
PS.: The element %s is used in polynomial definitions.
Is it all right now?
Thursday, February 11, 2010
I'm back and writing about strings
Hi everyone, I couldn't post anything these days because my computer have been used a lot for my mastering. But finally, I finished the simulations and now I can return to my blogs.
Let's do something with strings.
First case: you have a matrix of strings like following:
mat1 = ['john', 'Simon', 'Tonny'; 'jim', 'sam', 'phill'];
And you want a standard in the strings, look 'Simon' and 'Tonny' have capital letters ('S' and 'T').
Thus, we use convstr(.) function, as following:
mat1 = ['john', 'Simon', 'Tonny'; 'jim', 'sam', 'phill'];
mat_std_u = convstr(mat1, 'u')
mat_std_u =
!JOHN SIMON TONNY !
! !
!JIM SAM PHILL !
mat_std_l = convstr(mat1, 'l')
mat_std_l =
!john simon tonny !
! !
!jim sam phill !
And it's right now, all letters are in the same type.
If anyone wants anything more about string, ask me.
See you soon.
Friday, January 15, 2010
First of 2010
Happy and blessed 2010 for everyone!
Hi readers, I ask apologies for my absence.
My computer was working in my MSc's project and I couldn't make new posts here.
I received some comments, like this and this.
I'll answer your questions soon, when I come back from a travel in Jan, 25.
However, I say I haven't found anything about the vectors' colors.
If anyone knows how to control the colors of the arrows, in the champ(.) function, I ask you comment here.
Subscribe to:
Posts (Atom)